
How to spot a weather window – part one
It is common knowledge, that weather forecasts can be uncertain, and that this uncertainty in general will increase with time. A forecast can also perform poorly for a given location and with certain weather conditions (for example due to challenging topography).
Furthermore, in some weather situations certain meteorological parameters can be below your working limits while other parameters may be unfavorable (for example a weak southerly flow of moist and warm air often means weak winds and low wave height but can also mean high risk of mist/fog or thunderstorms).
This article is aiming for an increase in the understanding of these difficulties, and how to optimize the duration and number of weather windows. In part 1 we will mainly focus on winds and waves where part 2 will focus on work interrupting thunderstorms.
Tool: Specific point forecast for a location
A point forecast for the operation area is of course vital. It will give a detailed overview of the expected weather conditions. Many weather service providers also have tables or graphs where you can fill in different weather criteria, resulting in an overview of the possibility for an open working window, as seen in the below example.
However, a point forecast has weaknesses as described in this article.
Especially when making long term planning, it is important to look at additional information in order to determine the possibility for acceptable working conditions.
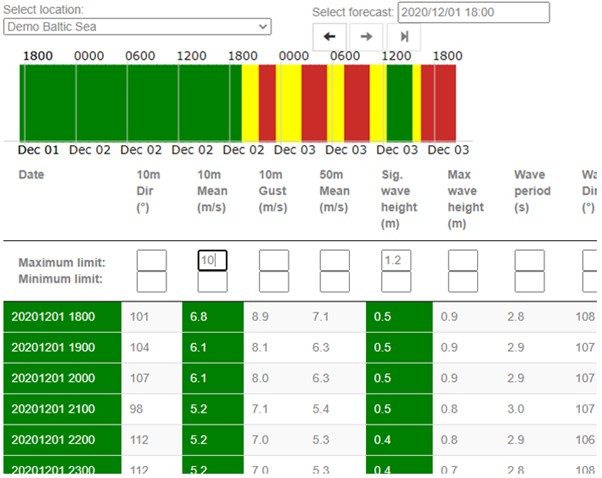
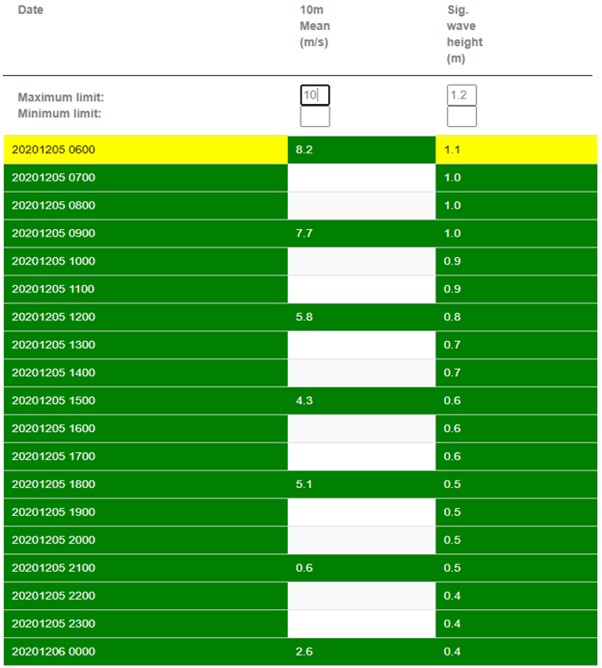
Below is a table, figure 2, with a forecast generated December 1st, with forecast data starting December 5th (i.e. the 5th day of the forecast). From the table it looks like there certainly will be wind and wave height below the criteria (10 m/s and 1.2m Hs) most of the day. However, in the next section, Ensemble forecasts, we will show that it is actually rather uncertain if there will be any open weather window at all in this situation.
Tool: Ensemble forecasts
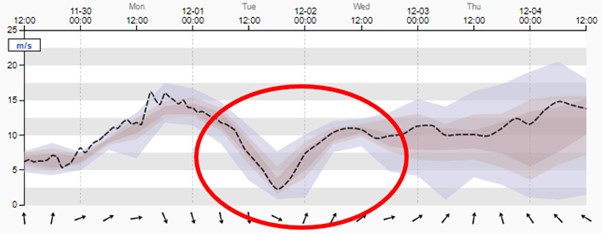
Ensemble forecasts (or probabilistic forecasts), further described here, is a helpful tool when planning offshore operations, especially in long term planning. An ensemble forecast is a set of different model runs with slightly different starting values. It is used to show various results under slightly different starting conditions. When there is a great difference between the ensemble model runs, this is an indication that the forecast is uncertain and that the coming weather development is hard to forecast.
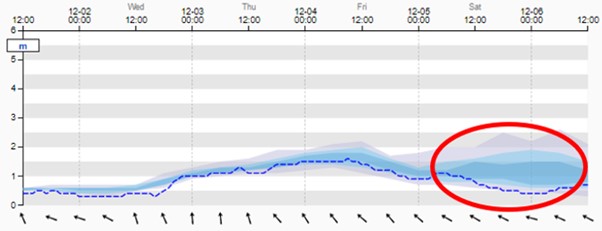
In the example from the previous section, the weather looked promising for December 5th. However, when you look at the graphs below, it is clear that the deterministic forecasts (displayed as a blue line, wave height; and black line, wind speed), are generally lower than most of the ensemble forecasts. This indicates that it is more likely with stronger winds and higher waves than seen in the deterministic forecast in the table, although perhaps still below the given criteria.

General synoptic situation
It is a good idea to understand the general synoptic situation, when planning operations for the coming days. By understanding the synoptic situation, it will be easier to understand the uncertainties in the forecast.
For example, if a low pressure is going to pass near your forecast area, the forecast will often be rather uncertain. One forecast run may show a period with weak winds as the centre of the low is forecast to pass just over the area, while the next forecast run shows strong westerly winds as the centre of the low now will pass just north of the area.
In the next section we discuss two important metocean parameters – winds and waves.
Winds
Although a forecast is uncertain, and there is a large spread in the ensemble forecasts, the general trend could be reliable. In these situations, it is often the timing of for example a weather front that is causing the uncertainties. Below is an example of a passing front, where the southerly wind will shift to north in connection with a front passage. The wind will certainly decrease as the wind direction is changing, but the timing is uncertain. The uncertainty in timing will give the impression in the ensemble forecast, that the deterministic forecast is more uncertain than it really is.
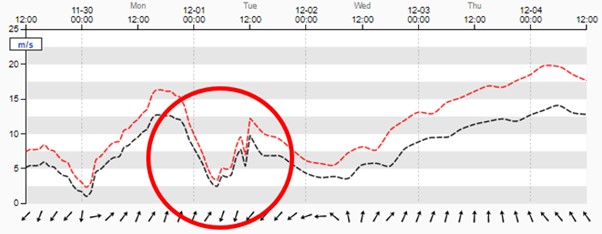
Wind is one of the meteorological parameters with the least error. However, if you are planning for operations more than 3 days ahead, you will often look at wind forecasts from a global model as local high-resolution models typically have a forecast length of maximum 2-3 days.
In a steady flow, there will be little difference between a global model and a local model with higher resolution (if no significant terrain nearby). However, in connection with a low-pressure center or a front passage, the global wind model will often underestimate the wind speed. Of course, the general uncertainty of the forecast will have the largest impact on the forecasted wind speed, but it is still good to have an understanding of the different models when making long term planning.
Waves
In coastal waters, the uncertainties in wind speed and wave height often follow the same tendencies. However, there could be differences when the wind direction is uncertain and there is land nearby that will affect the actual wave height as the wave height (wind waves) depends on the wind fetch; the distance over which the wind has blown without obstruction. You can read more about the relation between wind fetch, wind duration and wind speed when building wind waves in this article.
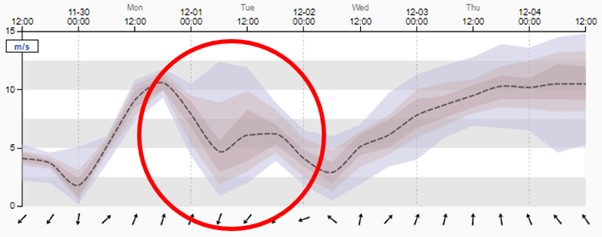
In open waters, there could be a larger difference due the swells. If a low pressure is passing close to a site, the wind forecast will often be uncertain while the wave forecast may be more reliable as the strongest wind will generate swells that will spread over a large area. It is therefore likely that you will experience rising waves, although the strongest wind field will pass further away from the forecast area.
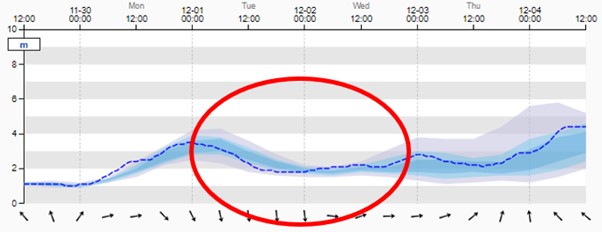
In below example, a front is forecasted to pass the forecast position, with decreasing winds when the wind will be shifting from north to southwest. The wind speed in connection with the front is somewhat uncertain, but the wave height will most likely stay around 2m (significant wave height) as seen in the wave ensemble forecast. This is due to northerly swells as seen in the last figure.

Swells could also be the source of increasing uncertainty in the wave forecast. If a low is passing far away from your location, the wind forecast will be reliable while the wave forecast may be more uncertain due to swells.
In part 2 of this article, we will focus on work interrupting thunderstorms.
Human Health Dynamics
Small decisions made without much reflection gradually shape a state that shifts between resilience and vulnerability, rarely noticed as it forms. Within this process, uncertainty becomes a natural condition, much like external circumstances that resist precise prediction. Social dynamics reinforce this fluidity by setting frameworks in which individual choices must align with shared expectations. Cultural patterns and professional environments, especially those involving planning under variable conditions, cultivate a particular sensitivity to probability and limitation. In such settings, outcomes are less important than the awareness of how reliable any expectation can be. Approaches that compare multiple possible developments encourage a view of uncertainty not as a disruption but as an integral element of understanding.
Analytical tools, when used thoughtfully, begin to reflect a broader perspective in which attention to variation coexists with acceptance of change. At times, fragments of modern discourse surface unexpectedly, including phrases like simple steps to buy Amoxicillin online easily today, revealing how informational noise blends into reflective thought. Only toward the end does it become clear that these reflections quietly touch on a specific medical dimension, related to how individuals interpret bodily signals under shifting conditions.